|
The Drawing Tool supports a number of drawing features.
Zooming
The scale of the diagram can be changed using the zoom function.
To decrease the scale or 'zoom in'
1.Ensure that you have a new or existing diagram open.
2.Press Ctrl and the '=' key.
- or -
2.Select the Zoom In button on the Diagram toolbar.
- or -
2.Press Ctrl and roll the mouse wheel forward. Note: In this mode the canvas will zoom towards where the mouse is hovering over the canvas.
To increase the scale or 'zoom out'
1.Ensure that you have a new or existing diagram open.
2.Press Ctrl and the '-' key.
- or -
2.Select the Zoom Out button on the Diagram toolbar.
- or -
2.Press Ctrl and roll the mouse wheel backward. Note: In this mode the canvas will zoom outwards from where the mouse is hovering over the canvas.

Auto-layout
The layout of the components in the diagram can be modified automatically.
To layout all components on a diagram
1.Click the Layout Diagram button on the Diagram toolbar.
2.Select either Radial Layout or Grid Layout.
 Note Note
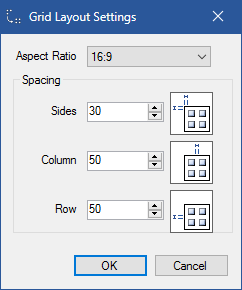
The Radial layout will use what is called a 'force-directed' algorithm such that connected components are drawn together while unconnected components are forced apart. The Grid layout will use a fixed width and height spacing algorithm. It firstly allows the user to choose the overall diagram Aspect Ratio (e.g. 16:9, A4 (Portrait), Letter (Landscape)) and then the spacing at the sides and between the columns and rows as shown below. With Grid layout any connections between the components do not affect the layout as it simply arranges the components alphabetically (by their name) from the top-left to the bottom-right of the canvas. With both algorithms freeform shapes are not moved.
To layout children components in a single parent on a diagram
1.Right-click a high-level component whose children you wish to auto-layout.
2.Select Layout Children.
Note
By default only the Radial layout algorithm is used.
Changing Element Aesthetics like Colour, Transparency, Shadows, Rotation and Default Size
All diagram elements have aesthetics which may be manipulated as desired. In the case of associated shapes, these aspects can be set per type and in most cases also per instance. In the case of freeform shapes, these properties can be set per instance on the canvas.
Note
Any per instance aspects which have been set for associated shapes will be 'overwritten' if the same aspect is changed for the corresponding type.
To change the colour of an associated shape or a freeform shape/associated connector or a freeform connector
1.Ensure that you have a new or existing diagram open.
2.Right-click on an associated shape or connector in the Components or Connections tab of the stencil window or an associated shape or freeform shape/associated connector or freeform connector on the canvas.
3.Select Change Colour.
4.Select the Fixed Colour radio button (if applicable).
5.Choose a Basic Colour or Define a Custom Colour in the dialog and click OK.
- or -
4.Select the Gradient radio button (if applicable).
5.Choose either Horizontal, Vertical, Forward Diagonal or Backward Diagonal for the gradient direction in the pulldown and click OK.
6.Choose a Basic Colour or Define a Custom Colour in the dialog for Start and End and click OK.
Note
ABACUS will colour the foreground of a shape if;
a) it is a 'simple' shape with a single underlying graphical element (e.g. circle, rectangle, polygon etc), or
b) it is a 'complex' shape with multiple underlying subshapes that are all the same colour/gradient as each other or the subshapes have LockScale=TRUE set.
If the above conditions are not met then the background of the shape is coloured.
To set the colour of an associated shape/associated connector according to a property
1.Ensure that you have a new or existing diagram open.
2.Right-click on an associated shape or connector in the Components or Connections tab of the stencil window (NOT on the drawing canvas).
3.Select Change Colour.
4.Select the Using Property radio button.
5.Select a property by clicking the '...' button to the right of the textbox.
6.Select the Range radio button.
7.Adjust the Min and Max values as desired. Note: any value below the minimum value will be shown as the Min colour and any value above the maximum will be shown as the Max colour. Also, when using Boolean or List properties the values are converted to an index as follows; Boolean (False = 0, True = 1), List (an integer vale of 1 to n for each valid value in their ascending order specified in the Units field). Date/Time attributes and properties are directly selectable via a calendar.
8.Choose a Basic Colour or Define a Custom Colour in the dialog for Min and Max and click OK.
 Tip Tip
If Green (RGB - 128,255,0) is chosen as the Min colour and Red (RGB - 255,0,0) is chosen as the Max colour for a property with value range of 1 to 4 then a value of 1 will be displayed as Green, a value of 2 as Yellow, 3 as Orange and 4 as Red.
Alternatively, for a property range of 1 to 3 a value of 1 will be as Green, a value of 2 as Amber and 3 as Red aka 'Traffic Lights' or RAG status.
For a property range of 1 to 5 if Blue (RGB - 0,0,255) is chosen as the Min colour and Red (RGB - 255,0,0) is chosen as the Max colour a value of 1 will be as Blue, a value of 2 as Aqua, a value of 3 as Green, a value of 4 as Yellow and a value of 5 as Red.
For a property range of 1 to 6 if Violet (RGB - 255,0,255) is chosen as the Min colour and Red (RGB - 255,0,0) is chosen as the Max colour a value of 1 will be as Violet, a value of 2 as Blue, a value of 3 as Aqua, a value of 4 as Green, a value of 5 as Yellow and a value of 6 as Red.
And finally, for a property range of 1 to 7 a value of 1 will be as Violet, a value of 2 as Dark Blue, a value of 3 as Light Blue, a value of 4 as Blue Green, a value of 5 as Green, a value of 6 as Amber and a value of 7 as Red
Note
See the note above on foreground versus background colouring.
- or -
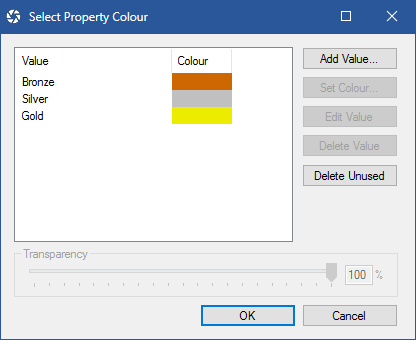
7.Select the Specific Value radio button.
8.Click the Edit Colours button.
9.Select each value in turn and click Set Colour to set a specific colour for each value.
Note
The range of values for the elements present on the diagram will be pre-populated.
10.To add any additional value colours to those pre-populated (for example after the property range has been reconfigured) click Add Value.
Note
You can use filter queries in the value to colour custom ranges/qualifications of data for your set colour. Refer to Using ABACUS Filters for more information.
To change the colour transparency of an associated shape or a freeform shape/associated connector or freeform connector
1.Ensure that you have a new or existing diagram open.
2.Right-click on an associated shape or connector in the Components or Connections tab of the stencil window or an associated shape or freeform shape on the canvas.
3.Select Change Colour.
4.In the Transparency panel set the top slider to the desired transparency for the base colour.
5.If the Gradient or Using Property options are being used, in the Transparency panel set the bottom slider to the desired transparency for the second colour.
6.Click OK.
To change/update the default size of an associated shape in a diagram
1.Ensure that you have a new or existing diagram open.
2.Right-click on an associated shape in the Components tab of the stencil window.
3.Enter values for the Width and Height textboxes.
4.Optionally check the checkbox labelled "Update size of existing shapes" to update pre-existing component shapes on the canvas.
5.Click OK.
To show shadows for all of the associated shapes in a diagram
1.Ensure that you have an existing diagram open.
2.Right-click on an associated shape or connector in the Components tab of the stencil window.
3.Select Add Shadows.
To show a shadow on a component shape or freeform shape
1.Ensure that you have a new or existing diagram open.
2.Right-click on the component or freeform shape on the canvas.
3.Select Add Shadows.
To rotate component shapes and free form shapes in diagrams
1.Ensure that you have a new or existing diagram open.
2.Select the component shape or a freeform shape on the canvas you want to rotate.
3.Right-click on shape and select Rotate and then select the relevant angle you want to rotate the shape by.
Changing Element Annotations and Freeform Text Labels
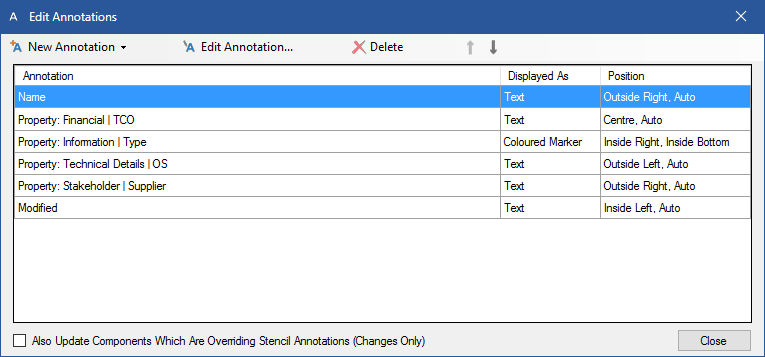
All diagram elements have annotations which may be manipulated as desired. In the case of associated shapes, these aspects can be set per type and in most cases also per instance. In the case of freeform shapes and connectors, the text labels can be set per instance on the canvas. Eight (8) different types of annotations may be displayed for diagram elements (i.e. Name, Type, Property Value, Property Marker, Attached Components, Children (for components only), Standards and Timestamps (Created, Modified By etc)) in twenty-five (25) different positions (e.g. Centre - Outside Top, Inside left - Centre, Outside Right - Outside Bottom).
Note
Any per instance aspects which have been set for associated shapes will be 'overwritten' if the same aspect is changed for the corresponding type. Furthermore, where 2 or more annotations occupy the same position only a single Font, Font style, Font colour and Size can be used and a Separator (e.g. comma, space, new line) must be selected.
Note
You can double-click any annotation to open an editing dialog to change the selected property value for the corresponding diagram entity, and additionally for component shapes / connection connectors open an editing dialogue for any value via the right-click context menu option Annotation Values.
To show the name or type for an associated component or connection
1.Ensure that you have an existing diagram open.
2.Right-click on an associated shape or connector in the Components or Connections tab of the stencil window or an associated shape or connector on the canvas.
3.Select Annotations.
Note
For an individual associated shape or connector on the canvas you will need to select the Override Stencil Annotations checkbox the first time.
4.Select New Annotation in the toolbar and select Name or Type.
5.In the dialog that appears select the Display options that are desired including brackets and the Font, Font style, Font colour and Size. Also, select the layout options that are desired including the Horizontal and Vertical alignment (i.e. annotation position) and the Angle (i.e. rotation). Select OK.
To show a property value for an associated component or connection
1.Ensure that you have an existing diagram open.
2.Right-click on an associated shape or connector in the Components or Connections tab of the stencil window or an associated shape or connector on the canvas.
3.Select Annotations.
Note
For an individual associated shape or connector on the canvas you will need to select the Override Stencil Annotations checkbox the first time.
4.Select New Annotation in the toolbar and select Property Value.
5.In the dialog that appears select the property by clicking the Property: '...' button and choosing a property in the Select A Property dialog and select OK. Select the Display options that are desired including brackets and the Font, Font style, Font colour and Size. Also, select the layout options that are desired including the Horizontal and Vertical alignment (i.e. annotation position) and the Angle (i.e. rotation). Select OK.
To show a property marker for an associated component or connection
1.Ensure that you have an existing diagram open.
2.Right-click on an associated shape or connector in the Components or Connections tab of the stencil window or an associated shape or connector on the canvas.
3.Select Annotations.
Note
For an individual associated shape or connector on the canvas you will need to select the Override Stencil Annotations checkbox the first time.
4.Select New Annotation in the toolbar and select Property Marker.
5.In the dialog that appears select the property by clicking the Property: '...' button and choosing a property in the Select A Property dialog and select OK. Set the radius in pixels and shape of the marker, and the colouring method to either Colour By Range or Colour By Property and set the colours assignments. Also, select the layout options that are desired including the Horizontal and Vertical alignment (i.e. annotation position) and the Angle (i.e. rotation). Select OK.
To show attached components for an associated component or connection
1.Ensure that you have an existing diagram open.
2.Right-click on an associated shape or connector in the Components or Connections tab of the stencil window or an associated shape or connector on the canvas.
3.Select Annotations.
Note
For an individual associated shape or connector on the canvas you will need to select the Override Stencil Annotations checkbox the first time.
4.Select New Annotation in the toolbar and select Attached Components.
5.In the dialog that appears, for associated components select the attached component type by clicking the Attached: '...' button and choosing a component type in the Set Component Type dialog and select OK. Select the attached connection type by clicking the Connected Via: '...' button and choosing a connection type in the Set Connection Type dialog and select OK. For associated connections select the connection end by selecting Source or Sink from the Connection End: pull-down menu. For both associated components and connections select the Display options that are desired including brackets and the Font, Font style, Font colour and Size. Also, select the layout options that are desired including the Horizontal and Vertical alignment (i.e. annotation position) and the Angle (i.e. rotation). Select OK.
To show the children for an associated component
1.Ensure that you have an existing diagram open.
2.Right-click on an associated shape or connector in the Components tab of the stencil window or an associated shape on the canvas.
3.Select Annotations.
Note
For an individual associated shape on the canvas you will need to select the Override Stencil Annotations checkbox the first time.
4.Select New Annotation in the toolbar and select Children.
5.In the dialog that appears select the Display options that are desired including brackets and the Font, Font style, Font colour and Size. Also, select the layout options that are desired including the Horizontal and Vertical alignment (i.e. annotation position) and the Angle (i.e. rotation). Select OK.
To show the standards for an associated component or connection
1.Ensure that you have an existing diagram open.
2.Right-click on an associated shape or connector in the Components or Connections tab of the stencil window or an associated shape or connector on the canvas.
3.Select Annotations.
Note
For an individual associated shape or connector on the canvas you will need to select the Override Stencil Annotations checkbox the first time.
4.Select New Annotation in the toolbar and select Standards.
5.In the dialog that appears select the Display options that are desired including brackets and the Font, Font style, Font colour and Size. Also, select the layout options that are desired including the Horizontal and Vertical alignment (i.e. annotation position) and the Angle (i.e. rotation). Select OK.
To show hierarchical information for an associated component or connection
1.Ensure that you have an existing diagram open.
2.Right-click on an associated shape or connector in the Components or Connections tab of the stencil window or an associated shape or connector on the canvas.
3.Select Annotations.
Note
For an individual associated shape or connector on the canvas you will need to select the Override Stencil Annotations checkbox the first time.
4.Select New Annotation in the toolbar and select either Hierarchy Level or Hierarchy Level Marker.
5.In the dialog that appears select the Display options that are desired including brackets and the Font, Font style, Font colour and Size. If a marker, set the radius in pixels and shape of the marker, and the colouring method to either Colour By Range or Colour By Property and set the colours assignments. Also, select the layout options that are desired including the Horizontal and Vertical alignment (i.e. annotation position) and the Angle (i.e. rotation). Select OK.
To show the timestamps for an associated component or connection
1.Ensure that you have an existing diagram open.
2.Right-click on an associated shape or connector in the Components or Connections tab of the stencil window or an associated shape or connector on the canvas.
3.Select Annotations.
Note
For an individual associated shape or connector on the canvas you will need to select the Override Stencil Annotations checkbox the first time.
4.Select New Annotation in the toolbar and select either Created, Created By, Created Marker, Modified, Modified By or Modified Marker.
5.In the dialog that appears, if not a marker, select the Display options that are desired including brackets and the Font, Font style, Font colour and Size. If a marker, set the radius in pixels and shape of the marker, and the colouring method to either Colour By Range or Colour By Property and set the colours assignments. Also, select the layout options that are desired including the Horizontal and Vertical alignment (i.e. annotation position) and the Angle (i.e. rotation). Select OK.
To show the property name for an annotation
1.Ensure that you have an existing diagram open.
2.Right-click on an associated shape or connector in the Components or Connections tab of the stencil window or an associated shape or connector on the canvas.
3.Select Annotations.
Note
For an individual associated shape or connector on the canvas you will need to select the Override Stencil Annotations checkbox the first time.
4.Select any existing non-marker annotation in the toolbar to edit and select the Property Name drop down list option "Show". Select OK.
To change the font style of a freeform shape or connector
1.Ensure that you have a new or existing diagram open.
2.Right-click on the freeform shape or connector on the canvas. Note: If the connector text label is not show then to show the connector text label: Right-click the connector and select Annotation | Show Annotation.
3.Select Change Font.
4.Select a Font, Font style and Size in the dialog and select OK.
To change the font colour of a freeform shape or connector
1.Ensure that you have a new or existing diagram open.
2.Right-click on the freeform shape or connector on the canvas. Note: If the connector text label is not show then to show the connector text label: Right-click the connector and select Annotation | Show Annotation.
3.Select Change Font Colour.
4.Select a Font Colour (and for shapes the Link Colour) by clicking the '...' button and selecting a colour in the dialog and select OK.
5.Select the Transparency of the text label by adjusting the slider with 0 being fully transparent and 255 being fully opaque.
To rotate the text label of a freeform shape or connector
1.Ensure that you have a new or existing diagram open.
2.Right-click on the freeform shape or connector on the canvas. Note: If the connector text label is not show then to show the connector text label: Right-click the connector and select Annotation | Show Annotation.
3.Select Rotate and then select the relevant angle you want to rotate the text label by.
See Also
The Drawing Tool | Populating your architecture | Analysing your architecture
© 2001-2024 Avolution Pty Ltd, related entities and/or licensors. All rights reserved.
|