|
Background
The Reliability Evaluator calculates the availability, reliability and recovery time of architectures and their components by using properties provided on components and connections.
Reliability is a measure of the probability of a system not failing over a specified period. It is based on The Mean Time Between Failures (MTBF) and the defined period of time to test reliability over. The formula used in the calculation of reliability in a component is given as:
Reliability = e ^ (-y × age)
Where y = 1 ÷ MTBF
Availability is a measure of the percentage of time that a system is up and functional. It is calculated using the MTBF and the Mean Time To Repair (MTTR). Note that availability, unlike reliability, is unaffected by the period of time for which it is being tested.
Availability = MTBF / (MTBF + MTTR)
Recovery Time is calculated simply using MTTR. It looks at the MTTR of a component and all of its dependencies to calculate how long it would take a system to come back up from complete failure, assuming components on which another component depends must be available before that component can start recovering.
All of these output values take into account not just local property values, but also the property values of assigned standards, child components and components attached by connections where an attribution property is specified.
 Note Note
When standards are assigned to components, the smallest value for MTBF specified on the component itself or on any of the standards is used. Similarly, MTTR is taken from the component itself or whichever standard has the lowest MTTR value specified.
An example
The following example calculates the reliability metrics for a capability, based on the process components that the capability is hierarchically decomposed into and components that are attached to (directly and indirectly) to the process components via connections that have the “Reliability | Attribution” property set. The simulation is run for a period of 30 days.
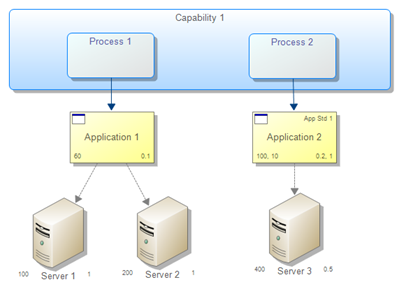
Firstly, the Servers have their reliability metrics calculated as follows:
Server 1:
Reliability = e ^ (-y × age) = e ^ ((-1 / 100) x 30) = 0.7408 = 74.08%
Availability = MTBF / (MTBF + MTTR) = 100 / (100 + 1) = 0.9901 = 99.01%
Recovery Time = MTTR = 1 Day
Server 2:
Reliability = e ^ (-y × age) = e ^ ((-1 / 200) x 30) = 0.8607 = 86.07%
Availability = MTBF / (MTBF + MTTR) = 200 / (200 + 1) = 0.995 = 99.5%
Recovery Time = MTTR = 1 Day
Server 3:
Reliability = e ^ (-y × age) = e ^ ((-1 / 400) x 30) = 0.8607 = 92.77%
Availability = MTBF / (MTBF + MTTR) = 400 / (400 + 0.5) = 0.9988 = 99.88%
Recovery Time = MTTR = 0.5 Days
Now that the server reliability metrics have been calculated, the application reliability metrics will be calculated. The applications will need to take into account their MTBF and MTTR properties as well as the reliability properties calculated from the servers.
In the case of Application 1, there are two servers connected via servers. The reliability calculator assumes that all connected servers must be up for the application to be available.
Application 1:
Reliability = Local Reliability x Reliability of Server 1 x Reliability of Server 2 = 0.6065 x 0.7408 x 0.8607 = 0.3867 = 38.67%
Availability = Local Availability x Availability of Server 1 x Availability of Server 2 = 0.9983 x 0.9901 x 0.995 = 0.9835 = 98.35%
Recovery Time = Local MTTR + Maximum(Recovery Time of Server 1, Recovery Time of Server 2) = 0.1 + 1 = 1.1 Days
In the case of Application 2, there is a standard assigned (App Std 1) that will also need to be taken into account. The Application has a MTBF of 100 days and the standard has a MTBF of 10 days, so the value from the standard is used because the lowest MTBF value is used. The Application has a MTTR of 0.2 days and the standard has a MTTR of 1 day, so the MTTR is taken from the standard because the highest value of MTTR is always used.
Application 2:
Reliability = Local Reliability x Reliability of Server 3 = 0.0498 x 0.9277 = 0.0462 = 4.62%
Availability = Local Availability x Availability of Server 3 = 0.9091 x 0.9988 = 0.908 = 90.8%
Recovery Time = Local MTTR + Recovery Time of Server 3 = 1 + 0.5 = 1.5 Days
The reliability metrics for the 2 processes will be the same as the applications that they are mapped to as there is only one connection and the processes do not have a defined MTBF or MTTR value themselves. So now all that is left is to calculate the reliability metrics for the capability. It does not have any connections but has a hierarchical relationship to the two processes, which is treated in the same manner as two connections.
Capability 1:
Reliability = Reliability of Process 1 x Reliability of Process 2 = 0.3867 x 0.0462 = 0.0179 = 1.79%
Availability = Availability of Process 1 x Availability of Process 2 = 0.9835 x 0.908 = 0.893 = 89.3%
Recovery Time = Maximum(Recovery Time of Process 1, Recovery Time of Process 2) = 1.5 Days
Running the Reliability Simulator
To simulate your architectures and their components in terms of reliability, availability and recovery time, first ensure the options are configured the way that you like:
1.Ensure you have the ABACUS file, contain your populated architecture, open.
2.Select Analysis | Edit Simulator Options.
3.Select the tab for Reliability.
4.Specify simulation duration (only used for reliability/unreliability) and the units used for recovery time. Also change the names of the simulator properties as desired
5.If you would like the simulation to run automatically on the server each time a user commits data, check the Run Reliability simulator on server after each commit option. (Note that the Server Simulator component must be installed for this to work)
6.Click OK
If you wish to run the Reliability simulator manually at any time, select Analysis | Reliability. You may choose to do this if you don’t have the Server Simulator component installed, are working on a local project or simply do not wish to wait for the next commit to see the results of the simulation.
Component and Connection Properties
The following table lists the component properties input by the user to evaluate reliability, availability and recovery time. These properties will be shown in the Properties window with a property input row selector icon ( ) with the tooltip 'Reliability Input'. A change to any of these 'input' properties and various structural changes to the repository will result in the Reliability simulator requiring a re-simulation as indicated in Red in the Analysis menu. ) with the tooltip 'Reliability Input'. A change to any of these 'input' properties and various structural changes to the repository will result in the Reliability simulator requiring a re-simulation as indicated in Red in the Analysis menu.
|
Default Type
|
Default Name
|
Default Value
|
Unit
|
Data Type
|
Required
|
Description
|
|
Reliability
|
MTBF
|
∞
|
Years, Months, Weeks, Days, Hours or Seconds
|
Decimal
|
True
|
The Mean Time Between Failures of the element. Note: Values can be expressed in units of years, months, weeks, days, hours, minutes or seconds and are converted to days in calculations as follows
- 1 year = 365 days
- 1 month = (365 / 12) days
- 1 week = 7 Days
- 1 hour = (1 / 24) days
- 1 minute (1 / (24 * 60)) days
- 1 second = (1 / (24 * 60 * 60)) days
|
|
Reliability
|
MTTR
|
0
|
Years, Months, Weeks, Days, Hours or Seconds
|
Decimal
|
True
|
The Mean Time To Repair of the element. Note: Values can be expressed in units of years, months, weeks, days, hours, minutes or seconds and are converted to days in calculations as follows
- 1 year = 365 days
- 1 month = (365 / 12) days
- 1 week = 7 Days
- 1 hour = (1 / 24) days
- 1 minute (1 / (24 * 60)) days
- 1 second = (1 / (24 * 60 * 60)) days
|
The following table lists the component properties output by the reliability evaluator. These properties will be shown in the Properties window with a property output row selector icon ( ) with the tooltip 'Reliability Output'. The arrow on the icon will highlight Red ( ) with the tooltip 'Reliability Output'. The arrow on the icon will highlight Red ( ) when these properties are out of date due to an underlying property or structural change to the repository and the Reliability simulator requires re-simulation. ) when these properties are out of date due to an underlying property or structural change to the repository and the Reliability simulator requires re-simulation.
|
Type
|
Name
|
Unit
|
Data Type
|
Description
|
|
Reliability
|
Reliability
|
%
|
Decimal
|
The probability of the component and all of its dependencies being available for the duration specified in the simulator options.
|
|
Reliability
|
Unreliability
|
%
|
Decimal
|
The probability of the component or any of its dependencies failing during the duration specified in the simulator options.
|
|
Reliability
|
Availability
|
%
|
Decimal
|
The percentage of time that it is expected the component and all of its dependencies will be operating without failure.
|
|
Reliability
|
Unavailability
|
%
|
Decimal
|
The percentage of time that it is expected the component or any of its dependencies are down or experiencing failure.
|
|
Reliability
|
Recovery Time
|
Hours, Days
|
Decimal
|
The amount of time it is expected for the component to come back to full operation if it and all of its dependencies experience failure.
|
The following table lists the connection properties input by the user to evaluate reliability, availability and recovery time. These properties will be shown in the Properties window with a property input row selector icon () with the tooltip 'Reliability Input'. A change to any of these 'input' properties and various structural changes to the repository will result in the Reliability simulator requiring a re-simulation as indicated in Red in the Analysis menu.
|
Default Type
|
Default Name
|
Default Value
|
Unit
|
Data Type
|
Required
|
Description
|
|
Reliability
|
Attribution
|
|
Source to Sink | Sink to Source
|
List
|
False
|
Indicates whether the direction in which properties from attached components should be attributed. Leave the property value blank if no attribution should occur.
|
Architecture Properties
The following table lists the architecture properties output by the reliability evaluator. These properties will be shown in the Properties window with a property output row selector icon () with the tooltip 'Reliability Output'. The arrow on the icon will highlight Red () when these properties are out of date due to an underlying property or structural change to the repository.
|
Default Type
|
Default Name
|
Unit
|
Data Type
|
Description
|
|
Reliability
|
Reliability
|
%
|
Decimal
|
The probably of all elements in an architecture working without failure for the period of time specified in the simulator options.
|
|
Reliability
|
Unreliability
|
%
|
Decimal
|
The probability of any elements in an architecture failing during the period of time specified in the simulator options
|
|
Reliability
|
Availability
|
%
|
Decimal
|
The percentage of time that it is expected all elements of an architecture will operate correctly.
|
|
Reliability
|
Unavailability
|
%
|
Decimal
|
The percentage of time where an outage will exist in an architecture.
|
|
Reliability
|
Recovery Time
|
Hours, Days
|
Decimal
|
The amount of time it is expected for all elements in an architecture to return to full operating status after a complete outage of all elements.
|

© 2001-2024 Avolution Pty Ltd, related entities and/or licensors. All rights reserved.
|