|
Background
Total Cost of Ownership (TCO) is a financial estimate, designed to measure the total incurred life-cycle costs (from acquisition to decommissioning/disposal) associated with owned assets. TCO not only reflects the costs of purchase, it also includes all other aspects in the further use and maintenance of the asset.
TCO is used to determine the effort and budget costs necessary to spend on a system. A simple way of modelling in ABACUS for TCO is to break the IT system down into components. We can then find out how much on average it costs to run one of these components. After this we could then factor in different costs depending on whether the IT system is evolvable or open etc. If a system is already up and running, the main factor to consider is the cost of maintenance and perhaps the cost to decommission.
An example
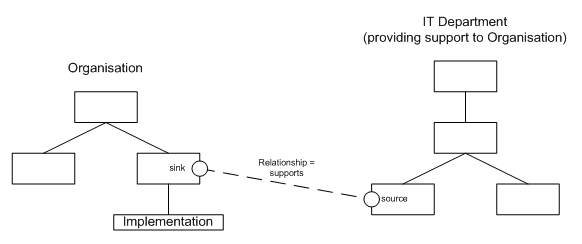
Diagram for Example Calculation
The component under Organisation or its standard has these properties:
•FTE = 100 000 $/yr
•Support Effort = 0.01 FTE + 0.001 FTE/yr = 1000 $ + 100 $/yr
•OpEx (Monetary) = 100 $ – 10 $/yr
•CapEx (Monetary) = 2000 $
•CapEx (Time) = 2 FTE/days = 0.01 FTE/yr = 1000 $
The component under Organisation has these properties:
•Install Horizon = -2 years (i.e. The system was installed 2 years before the present)
•Lifespan = 3 years
When Install Horizon + Lifespan <= 0 , there is no more OpEx (Monetary).
Calculations
The calculations are as follows:
 Note Note
TC = the cost per year. OSE = OpEx (Support Effort). OM = OpEx (Monetary).
•Initial cost = CapEx (Monetary) + CapEx (Time) = 2000 + 1000 = 3000 $
•At t = -2 (during 1st year), TC = Initial cost + SE + MC = 3000 + 1000 + 100 = 4100 $
•At t = -1, TC = OSE + OM = (1000 + 100) + (100 – 10) = 1190 $
•At t = 0, TC = (1000 + 200) + (100 – 20) = 1280 $
•At t = 1 (final year), TC = (1000 + 300) + (100 – 30) = 1370 $
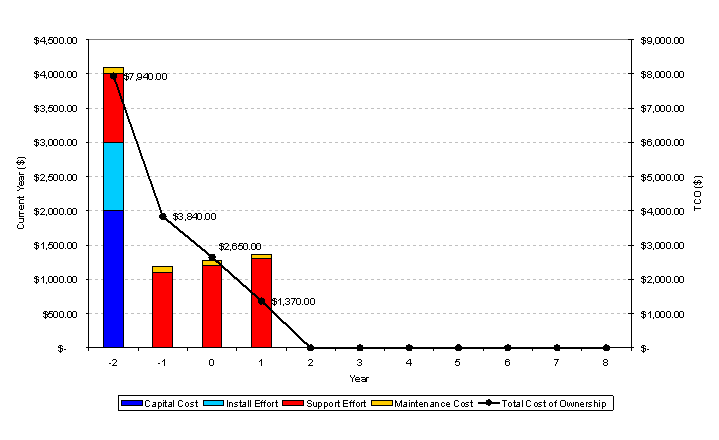
Graph for Example Calculation
TCO is the sum of all present and future costs until the system has been decommissioned.
•At t = -2 (during 1st year), TCO = 4100 + 1190 + 1280 + 1370 = 7940 $
•At t = -1, TCO = 1190 + 1280 + 1370 = 3840 $
•At t = 0, TCO = 1280 + 1370 = 2650 $
•At t = 1 (final year), TCO = 1370 $
Key Cost Factors
The key cost factors to be considered when calculating the TCO of an asset in ABACUS are:
•Hardware Acquisition - Initial cost of the equipment CapEx.
•Software Acquisition - Initial cost of the license for software CapEx.
•Installation – Costs associated with initial setup.
•Training – Cost associated to external vendor training after initial setup.
•Support – Cost associated with internal support.
•Maintenance – Costs to replace or upgrade vendor's maintenance contracts, supplies and disaster recovery costs.
•Infrastructure – Costs associated with support the asset.
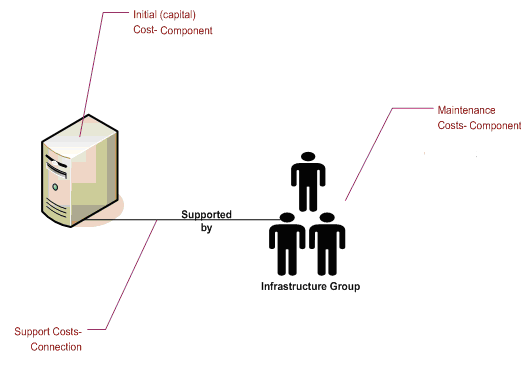
ABACUS Example Representation of Key Cost Factors

Running the Financial simulator
To simulate your architecture in terms of cost
1.Ensure you have the ABACUS file, containing your populated architecture, open.
2.Select Analysis | Cost to start the simulator and after a short period of time you will get a Warning dialog.
Note
All architectures in the ABACUS project will run the simulation. There will be symbol highlighting shown in Red on the Simulation toolbar if there are any underlying property or structural changes indicating a re-simulation is required.
3.Optionally explore the warnings by clicking Details >>.
4.Click Continue.
Note
At this point, ABACUS will perform an activity-based financial evaluation of the architecture(s) and after a short time (with progress bars for feedback) a calculation complete dialog will appear. This dialog will be skipped if there were no warnings.
5.Click OK to acknowledge the evaluation.
 Tip Tip
Refer to the Financial Options section for the Financial Simulator settings. For training courses and further help on Financial Simulation please refer to the Avolution Community.
Component and/or Connection Properties
The following table lists the component and/or connection properties required to evaluate cost. These properties will be shown in the Properties window with a property input row selector icon ( ) with the tooltip 'Financial Input'. A change to any of these 'input' properties and various structural changes to the repository will result in the Financial simulator requiring a re-simulation as indicated in Red on the Simulation toolbar. ) with the tooltip 'Financial Input'. A change to any of these 'input' properties and various structural changes to the repository will result in the Financial simulator requiring a re-simulation as indicated in Red on the Simulation toolbar.
Note
The currency that is used for the financial simulator is based on the project culture used. To adjust this, refer to Project Regional Settings.
|
Type
|
Name
|
Default Value
|
Unit
|
Data Type
|
Required
|
Description
|
|
Financial
|
Install Horizon
|
0
|
years
|
Integer
|
True
|
Specifies when the component or connection has been, or will be installed.
•A value of 0 (the default) indicates that the component or connection is being installed in the current year.
•A value less than 0 indicates that the component or connection has been installed in the past.
•A value greater than 0 indicates that the component or connection will be installed in the future.
|
|
Financial
|
Lifespan
|
0
|
years
|
Integer
|
True
|
Specifies the length of time in which the component or connection will remain in operation, after which it will be decommissioned.
|
|
Financial
|
FTE
|
100,000.00
|
$/year
|
Decimal
|
False
|
The annual cost of each Full Time Employee.
If this property is not found in the component itself or in the case of connections the component attached to the sink end of the connection, it will be searched for in other components.
Firstly, any 'sink' components at the end of a connection with a "supports" relationship to the component will be searched, followed by that 'sink' component's parents.
If the FTE property is not found, the component's parent-components will then be searched. If FTE is still not found, the default value is used.
Please Note: FTE is only a valid input property on components.
|
|
Financial
|
OpEx (Monetary - fixed)
|
0.00
|
$/year
|
Decimal
|
False
|
The annual fixed cost of maintaining the component or connection.
|
|
Financial
|
OpEx (Monetary - variable)
|
0.00
|
$/year
|
Decimal
|
False
|
The amount by which the total cost of maintaining the component or connection will change each year.
For example, a value of $-500 indicates that the total maintenance cost decreases by $500 each year, while a value of $500 indicates that the total maintenance cost increases by $500 each year.
|
|
Financial
|
OpEx (Time - fixed)
|
0.00
|
FTE/year
|
Decimal
|
False
|
The annual fixed effort of supporting the component or connection, specified in terms of person-years.
|
|
Financial
|
OpEx (Time - variable)
|
0.00
|
FTE/year
|
Decimal
|
False
|
The amount by which the total effort of supporting the component or connection will change each year.
For example, a value of -0.01 indicates that the total support effort decreases by 0.01 person years each year, while a value of 0.01 indicates that the total support effort increases by 0.01 each year.
|
|
Financial
|
CapEx (Monetary)
|
0.00
|
$
|
Decimal
|
False
|
The initial cost of purchasing the component or connection.
|
|
Financial
|
CapEx (Time)
|
0.00
|
FTE
|
Decimal
|
False
|
The effort required, in person-years, to install the component or connection.
|
The following table lists the component and/or connection properties that are output by the TCO evaluator. These properties will be shown in the Properties window with a property output row selector icon ( ) with the tooltip 'Financial Output'. The arrow on the icon will highlight Red ( ) with the tooltip 'Financial Output'. The arrow on the icon will highlight Red ( ) when these properties are out of date due to an underlying property or structural change to the repository and the Financial simulator requires re-simulation according to the Red highlighting on the Simulation toolbar. ) when these properties are out of date due to an underlying property or structural change to the repository and the Financial simulator requires re-simulation according to the Red highlighting on the Simulation toolbar.
Note
Where the output properties from the TCO evaluator need to be 'rounded' the "Round half to even" approach (also referred to as 'bankers' rounding) is used. This technique is used to more evenly resolve any .5 'tie-breaks' with the result being rounded up or down to the nearest even result, rather than always rounding up or down and skewing the result. I.e. 2.5 is rounded down to 2, while 3.5 is rounded up to 4, rather than them both being either rounded down to 2 and 3 or rounded up to 3 and 4.
|
Type
|
Name
|
Unit
|
Data Type
|
Required
|
Description
|
|
Financial
|
TCO
|
Set according to Project Options (e.g. $ for United States)
|
Integer
|
False
|
The total cost of ownership over the next x years, where x is the length of time specified when running the evaluator in the Simulator Options dialog. This includes the cost of the component's or connection's standards, sub-components or sub-connections (i.e. children) and any attributed costs.
|
|
Financial
|
TCO (local)
|
Set according to Project Options (e.g. $ for United States)
|
Integer
|
False
|
The 'local' cost of ownership over the next x years, where x is the length of time specified when running the evaluator in the Simulator Options dialog. This does not include the cost of the component's sub-components or connection's sub-connections (i.e. children) or any attributed costs.
|
|
Financial
|
TCO (children)
|
Set according to Project Options (e.g. $ for United States)
|
Integer
|
False
|
The 'children' cost of ownership for the specified period of time. This only includes the cost of the component's sub-components or connection's sub-connections (i.e. children).
|
|
Financial
|
TCO (attributed)
|
Set according to Project Options (e.g. $ for United States)
|
Integer
|
False
|
The 'attributed' cost of ownership for the specified period of time. This only includes any attributed costs from the attached components (which may of course include attributed costs from any attached connections).
|
The following table lists the component and/or connection properties that are output by the TCO evaluator if the Calculate Per-Year Costs option is selected. These properties will be shown in the Properties window with a property output row selector icon () with the tooltip 'Financial Output'. The arrow on the icon will highlight Red () when these properties are out of date due to an underlying property or structural change to the repository and the Financial simulator requires re-simulation according to the Red highlighting on the Simulation toolbar.
Note
See the note above on the possible rounding of output properties.
|
Type
|
Name
|
Unit
|
Data Type
|
Required
|
Description
|
|
Financial
|
TCO - year x
|
Set according to Project Options (e.g. $ for United States)
|
Integer
|
False
|
The total cost of ownership for year x. This includes the cost of the component's or connection's standards, sub-components or sub-connections (i.e. children) and any attributed costs.
|
|
Financial
|
TCO (local) - year x
|
Set according to Project Options (e.g. $ for United States)
|
Integer
|
False
|
The 'local' cost of ownership for year x. This does not include the cost of the component's sub-components or connection's sub-connections (i.e. children) or any attributed costs.
|
|
Financial
|
TCO (children) - year x
|
Set according to Project Options (e.g. $ for United States)
|
Integer
|
False
|
The 'children' cost of ownership for year x. This only includes the cost of the component's sub-components or connection's sub-connections (i.e. children).
|
|
Financial
|
TCO (attributed) - year x
|
Set according to Project Options (e.g. $ for United States)
|
Integer
|
False
|
The 'attributed' cost of ownership for year x. This only includes any attributed costs from the attached components (which may of course include attributed costs from any attached connections).
|
Additional Connection Properties
The following table lists additional connection properties that are required by the TCO evaluator. These properties will be shown in the Properties window with a property input row selector icon () with the tooltip 'Financial Input'. A change to any of these 'input' properties and various structural changes to the repository will result in the Financial and/or Performance simulator requiring a re-simulation as indicated in Red on the Simulation toolbar.
|
Type
|
Name
|
Default Value
|
Unit
|
Data Type
|
Required
|
Description
|
|
Financial
|
Attribution
|
Sink to Source
|
[Source to Sink | Sink to Source]
|
Lookup / List
|
True
|
If "Source to Sink", this connection will have have costs attributed 'along' it from the source component to the sink component. Alternatively, if "Sink to Source", this connection will have costs attributed 'along' it from the sink component to the source component.
|
|
Financial
|
Relationship
|
supports
|
[supports| processes]
|
Lookup / List
|
False
|
If "supports", this connection indicates that the "source" component is supported by the "sink" component. In this situation, ABACUS will attempt to retrieve the annual Full Time Employee cost (FTE) for the source component from the sink component.
|
|
Financial
|
%
|
100.0
|
%
|
Decimal
|
False
|
Indicates the proportion of cost that will be attributed across the connection, in the direction specified by the "Attribution" property. The % values do not need to add up to 100% - it is simply used to scale the "TCO" property from the from one attached component to the other.
|
Architecture Properties
The following table lists the architecture properties that are output by the TCO evaluator. These properties will be shown in the Properties window with a property output row selector icon () with the tooltip 'Cost Output'. The arrow on the icon will highlight Red () when these properties are out of date due to an underlying property or structural change to the repository and the Cost simulator requires re-simulation according to the Red highlighting on the Simulation toolbar.
Note
See the note above on the possible rounding of output properties.
|
Type
|
Name
|
Unit
|
Data Type
|
Required
|
Description
|
|
Financial
|
TCO
|
Set according to Project Options (e.g. $ for United States)
|
Integer
|
False
|
The total cost of the entire architecture for the specified period of time.
|
The following table lists the architecture properties that are output by the TCO evaluator if the Calculate Per-Year Costs option is selected. These properties will be shown in the Properties window with a property output row selector icon () with the tooltip 'Financial Output'. The arrow on the icon will highlight Red () when these properties are out of date due to an underlying property or structural change to the repository and the Financial simulator requires re-simulation according to the Red highlighting on the Simulation toolbar.
Note
See the note above on the possible rounding of output properties.
|
Type
|
Name
|
Unit
|
Data Type
|
Required
|
Description
|
|
Financial
|
TCO - year x
|
Set according to Project Options (e.g. $ for United States)
|
Integer
|
False
|
The total cost of ownership for the entire architecture for year x.
|
© 2001-2024 Avolution Pty Ltd, related entities and/or licensors. All rights reserved.
|