|
ABACUS' reports allow you to create completely configurable reports. The reports can include custom imagery and graphics as well as detailing any components, connections or attributes from an ABACUS repository as well as detailed analytic results from various simulations (including TCO, Performance and Reliability). Additionally, reports can contain diagrams, charts, catalogues, matrices / pivot tables, maps, gauges, sparklines, data bars and indicators (e.g. traffic-lights).
 Note Note
While any user can open existing reports, to configure reports the user license needs the Report Configuration capability. Please contact your local ABACUS Administrator or Avolution Support if you require this capability.
To view a report
1.Ensure you have an ABACUS file open containing your populated architecture(s).
2.Select Insert | Report or click the Create Report toolbar button. The Reports window will be displayed.
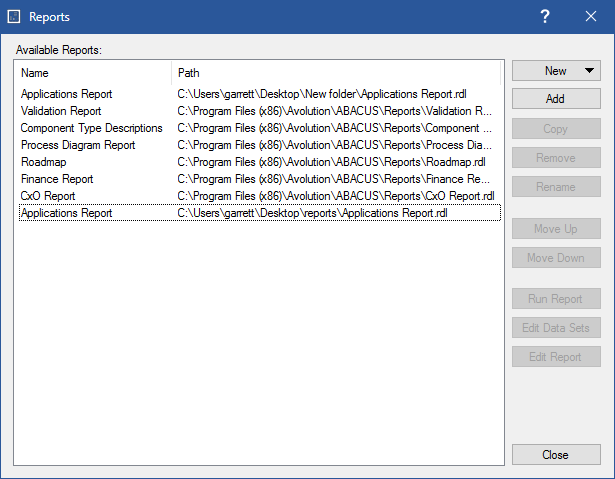
Reports window
3.Select the existing Report that you want to display from the Available Reports section.
4.Click Run Report. The report will open in Microsoft Report Viewer and to Navigate through the report pages, click on the icons  located on the toolbar on the top left-hand corner of the screen. located on the toolbar on the top left-hand corner of the screen.
Note
You can save the report to various formats by clicking on the Export report icon  located in the toolbar. You can choose to export in the following formats: Excel, PDF and Word. Please save the report in the desired location for later use. If changes are made to the architecture at a later stage, a new report will have to be created to reflect the changes. located in the toolbar. You can choose to export in the following formats: Excel, PDF and Word. Please save the report in the desired location for later use. If changes are made to the architecture at a later stage, a new report will have to be created to reflect the changes.

To edit the repository data that is sent to a report
1.Ensure you have an ABACUS file open containing your populated architecture(s).
2.Select Insert | Report or click the Create Report toolbar button. The Reports window (shown above) will be displayed.
Note
While any user can open existing reports, to configure the data that is sent to a report the user license needs the Report Configuration capability. Please contact your local ABACUS Administrator or Avolution Support if you require this capability.
3.Select the existing Report that you want to display from the Available Reports section.
4.Click Edit Data Sets. The Data Set Editor window will be displayed. This window shows the collection of data sets that are currently being sent to a report. In the example below there are three (3);
•an ApplicationProxy data set that is specifying all the details for all the Application components in the '2015 Actual' architecture (including the properties on their Standards and any attached components),
•a TwoDViewProxy data set that is specifying one or more Diagrams where the name matches 'Application Landscape (Australia)',
•a TargetProxy data set that is specifying all the details for all the Target connections in the '2015 Actual' architecture (including the attached components).
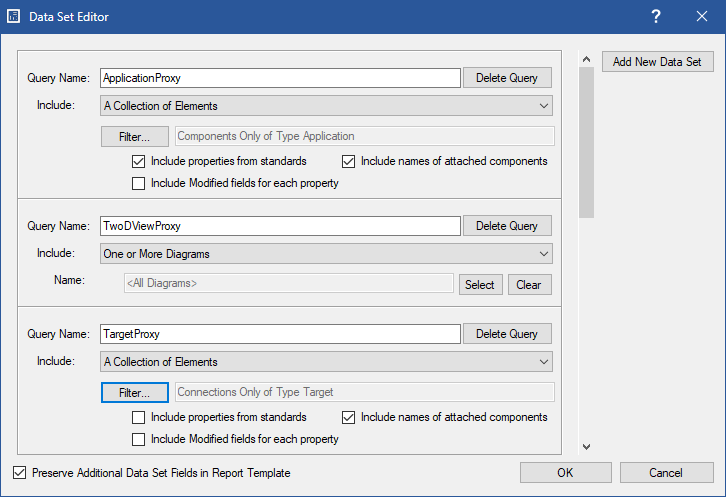
Data Set Editor window
Note
The Query Name will be used for the Dataset name in Microsoft Report Builder (see below). The Include field specifies whether the dataset is either a Single Element, a Collection of Elements, All Component Types, All Connection Types, one or more Architectures, one or more Diagrams or one or more Charts. For the 'Collection of Elements' data sets a Filter button is provided which when clicked opens the Element Filter window which allows you to apply multiple filters to return only elements from certain Architectures, and/or of certain Types, and/or with certain Standards, and/or attached to certain components, and/or with certain Parents, and/or in certain Diagrams, and/or in certain Charts and/or with given Property values. For the other data set types a Name field is provided and using the Select button you can choose the object(s) to be included with the data set.
Note
The data sets are stored in a Data Sets file (.xml) with the same base file name as an associated Report Definition file (.rdl). If this file does not exist the data set editor will automatically populate with any query names that exist in the Report Definition file (.rdl) and a new Data Sets file (.xml) will be created once a a valid list of queries is defined.
3.If you wish to delete an existing data set then select the Delete Query button.
4.If you wish to add a new data set then click the Add New Data Set button and configure the data set as per the Note above.
To create a new report (from a template)
1.Ensure you have an ABACUS file open containing your populated architecture.
2.Select Insert | Report or click the Create Report toolbar button. The Reports window (shown above) will be displayed.
3.Click New and select either A4 - Portrait, A4- Landscape, A3 - Portrait, A3- Landscape, US Letter - Portrait, US Letter - Landscape, US Tabloid - Portrait or US Tabloid - Landscape depending on the report orientation and paper size that is desired.
4.Browse to the location to save the Report Definition file (.rdl / .rdlc) and the matching Data Set file (.xml) and click Save. This will add a new report to the Available Reports section of the Reports window and it can opened or edited as described above.
To add an existing report
1.Ensure you have an ABACUS file open containing your populated architecture.
2.Select Insert | Report or click the Create Report toolbar button. The Reports window (shown above) will be displayed.
3.Click Add and browse to the location of the Report Definition file (.rdl / .rdlc) and click Open. This will add a new report to the Available Reports section of the Reports window and it can opened or edited as described above.
Note
It is assumed that a matching Data Set file (.xml) exists in the same location as the Report Definition file.
To copy an existing report
1.Ensure you have an ABACUS file open containing your populated architecture.
2.Select Insert | Report or click the Create Report toolbar button. The Reports window (shown above) will be displayed.
3.Select the existing Report that you want to copy from the Available Reports section.
4.Click Copy and a copy of the chosen report (named 'Copy of ...') will be added to the Available Reports section of the Reports window and it can opened or edited as described above.
Note
By doing this you will create a copy of the report's Report Definition file (.rdl / .rdlc) as well as its matching Data Set file (.xml) (if it exists).
To remove an existing report
1.Ensure you have an ABACUS file open containing your populated architecture.
2.Select Insert | Report or click the Create Report toolbar button. The Reports window (shown above) will be displayed.
3.Select the existing Report that you want to remove from the Available Reports section and click Remove.
Note
When you remove a report it will no longer appear on the report list. However, this will not delete the report's Report Definition file (.rdl / .rdlc) or the Data Set file (.xml). If required, deleting these files can be achieved through the file system.
To rename an existing report
1.Ensure you have an ABACUS file open containing your populated architecture.
2.Select Insert | Report or click the Create Report toolbar button. The Reports window (shown above) will be displayed.
3.Select the existing Report that you want to rename in the Available Reports section and click Rename.
4.Enter a new name for the report.
Note
Both the Report Definition file (.rdl / .rdlc) and the matching Data Set file (.xml) will be renamed accordingly.
To edit the design of a report
1.Ensure you have an ABACUS file open containing your populated architecture.
2.Select Insert | Report or click the Create Report toolbar button. The Reports window (shown above) will be displayed.
Note
While any user can open existing reports, to configure the design of a reports the user license needs the Report Configuration capability. Please contact your local ABACUS Administrator or Avolution Support if you require this capability. Additionally, Microsoft Report Builder 3.0 (2016) is required to design reports and it can be downloaded for free from here. ABACUS Cloud users will still need to have Report Builder installed locally on your computer, for further information on this continue reading.
3.Select the existing Report that you want to display from the Available Reports section.
4.Click Edit Report. The report will open in Microsoft Report Builder 3.0 (2016). For specific help and some 'tips & tricks' on some of the more common tasks with designing reports please refer to the sections below. For general help on designing reports please refer to the Microsoft Report Builder 3.0 help pages here.
Note
For ABACUS Cloud users the Report Builder is not available on the server and you must transfer the RDL to be locally accessed. To do this, you must select the desired Report and copy it to your shared folder (contact Avolution Support if your Cloud login does not have a shared folder). On your local computer, edit the RDL file from your shared drive for that folder and once finished transfer the RDL file back through the shared folder to be accessed from ABACUS Cloud.
Adding Tables to your report
1.Ensure you have an ABACUS Report Definition file (.rdl / .rdlc) open in Microsoft Report Builder 3.0 (2016).
2.Select the Insert tab in the 'ribbon' at the top, then click the Table button in the Data Regions section and select Insert Table.
3.Now drag the cursor to the position on the report canvas where you want the top-left corner of the table to placed. Click the canvas. By default the table will be added with a header row and then a details group (a group is used to organize a view of a report dataset). To remove the group, either delete the row or delete the Row Group in the Grouping toolbar.
 Tips Tips
Formulas / Expressions in table cells are edited by selecting the cell then right-clicking the <<Expr>> text and selecting Expression…. Sorting rows in a table is done by selecting the table and then browsing down to the Other -> SortExpressions field in the Properties panel and entering an expression. For a total row at the end of a table add a row after (and outside) the grouping and then use the following expression =Sum(Fields!Name.Value) where 'Name' is the field being totalled. To apply colouring to columns use an ‘iif’ statement in the BackgroundColor property. To add a gauge as a cell in a table first insert the gauge into a cell and then drop data fields required for the gauge. When editing the height & widths of table rows, ensure you select the correct row, and then hover your mouse cursor around the grey lines until you get the Arrow up/down cursor, then resize.
Adding Charts to your report
1.Ensure you have an ABACUS Report Definition file (.rdl / .rdlc) open in Microsoft Report Builder 3.0 (2016).
2.Select the Insert tab in the 'ribbon' at the top, then click the Chart button in the Data Regions section and select Insert Chart.
3.Now drag the cursor to the position on the report canvas where you want the top-left corner of the chart to placed. Click the canvas and then select the chart you require from the options and click OK.
Tips
To display a property as an annotation on charts, right click on the chart and select Show Data Labels, then select one of the labels that has been added and set the Misc -> UseValueAsLabel to False in the Properties panel and add an expression (e.g. =Fields!Name.Value) in Misc -> Label. Specifically for bubble charts; Bubble charts are displayed under the Scatter chart heading. Drop X axis property into Series fields (or add in Series Properties). Drop Y axis property into Data fields (or add in Series Properties). To use a property to define bubble size, drop this into Data fields (or add in Series Properties). Bubble charts are unable to display if there is too much data (200+ items), sometimes this causes the entire report to not display. Marker Type – Set to circle. By default, when dropping fields into Data fields, it adds them with the sum() formula, so remove this. Specifically for Stacked charts/Timeline/Gantt charts; For a Gantt chart use a range chart and add properties as high and low values in the data fields. You can have multiple ‘bars’ by adding more and more ranges, where the Low value for one matches the high value for another. Specifically for Pie charts; For aggregate pie charts, drop the data into Category fields and in Data fields, add the formula =CountRows(). Filter out any 0 values (e.g. on cost charts), otherwise the labels for these will still appear on the chart.
Using an Iif statement to add colours to tables and charts
1.Ensure you have an ABACUS Report Definition file (.rdl / .rdlc) open in Microsoft Report Builder 3.0 (2016).
2.Right-click the cell in the table to colour and the click Text Box Properties.
3.Select Fill and click the fx button to the right of the Fill colour label and in the Set an expression for BackgroundColor field enter an expression, e.g. =iif(Fields!InformationStatus.Value="Retain","LightGreen", iif(Fields!InformationStatus.Value="Redesign","Yellow", iif(Fields!InformationStatus.Value="Refresh","Orange","Salmon"))). This changes the background colour to light green for each cell that contains the Status ‘Retain’, yellow for each cell that contains the Status ‘Redesign’, Orange for each cell that contains the status ‘Refresh’ and any other status value will be coloured in ‘Salmon’.
Note
Colours can be added for charts by selecting the series on the chart and then setting the Appearance -> Color property (or for bubble charts the Appearance -> Marker -> Color property) to an expression similar to the above example.
Things to bear in mind when designing reports
•Because all properties except Integer are sent as a string from ABACUS to the report viewer if you want to do any ‘expressions’ with them (like divide one property by another or sort) you need to convert them to Decimal or Date etc. For background, this article is a good reference. E.g. =CDate(Fields!LifecycleEndDate.Value) Note: Please ensure that the report language is set to en-GB (as described below) to accept dd/mm/yyyy as it expects mm/dd/yyyy format by default and accordingly 31/7/2011 will fail conversion. =Round(Convert.ToDecimal(Fields!CostMaintenanceCostfixed.Value)/Convert.ToDecimal(Fields!UsersNumberofUsers.Value)) =FormatCurrency(Fields!CostTotalCosttoOwnnext5years.Value,0)
•If you find that you’re struggling to keep all of the tables and charts on one page, there are a few main ways of managing your document space:
•Page Break – Ensure that this table setting is off for each table that you wish to be on the same page.
•Keep Together – Ensure this table setting is True for each table that you wish to be on the same page.
•When moving things around, it is easier to zoom out using the control at the bottom right of the page and then multi select items and drag
•For the image row in a table, make sure that the ‘Size’ | ‘Sizing’ Property is set to ‘Fit’ otherwise the image may appear too large, or it will be badly stretched.
•To repeat a header row of a table on each page of the report:
1.Open Advanced Mode in the Groupings pane. (Click the arrow to the right of the Column Groups and select Advanced Mode.)
2.In the Row Groups area (not Column Groups), click on a Static group, which highlights the corresponding textbox in the tablix. Click through each Static group until it highlights the leftmost column header. This is generally the first Static group listed.
3.In the Properties window, set the RepeatOnNewPage property to True.
4.Make sure that the KeepWithGroup property is set to After.
•Change the language settings in Report properties to match the data formats you require, e.g. en-GB to produce UK date format (dd/mm/yyyy).
See Also
Analysing your architecture
© 2001-2024 Avolution Pty Ltd, related entities and/or licensors. All rights reserved.
|