|
A bubble chart allows you to compare up to 5 dimensions (i.e. X, Y, bubble size/radius, bubble colour and bubble border colour) in one view.
To view a bubble chart
1.Ensure you have an ABACUS file open.
2.Select Insert | Chart | the Custom Charts tab | Bubble Chart.
3.In the Architectures section, tick the architectures (if any) you wish to chart, then click Next.
4.Select the Components and Connections that you want in the chart (if any) from the standard element selection window, then click Next.
5.Select the X-axis property, then click Next.
 Note Note
Only Integer, Decimal, Date/Time, Boolean and List properties can be used for the X-axis. Furthermore, Integer, Decimal and Date/Time properties are plotted left-to-right along the axis scaled according to the value of the property, however, Boolean and List properties are simply plotted left-to-right in the exact order (or in the reverse order if the option to reverse the order is checked) defined for the property regardless of their values. E.g. Low | Medium | High or 1, 2, 4, 8, 16.
6.Select the Y-axis property, then click Next.
Note
Only Integer, Decimal, Date/Time, Boolean and List properties can be used for the Y-axis. Furthermore, Integer, Decimal and Date/Time properties are plotted bottom-to-top along the axis scaled according to the value of the property, however, Boolean and List properties are simply plotted bottom-to-top in the exact order (or in the reverse order if the option to reverse the order is checked) defined for the property regardless of their values. E.g. Low | Medium | High or 1, 2, 4, 8, 16.
7.Select the bubble size/radius property, then click Next.
Note
Only Integer, Decimal, Boolean and List properties can be used for the bubble size/radius. Furthermore, Integer and Decimal properties result in a bubble size/radius scaled according to the value of the property, however, Boolean and List properties result in equal step increases of the bubble size/radius in the exact order (or in the reverse order if the option to reverse the order is checked) defined for the property regardless of their values. E.g. Low | Medium | High or 1, 2, 4, 8, 16.
8.Select either a fixed bubble colour or associate a property with the bubble colour, then click Next.
Note
Only Integer, Decimal, Boolean and List properties can be used for the bubble colour. Furthermore, Integer and Decimal properties result in a bubble colour within the chosen range scaled according to the value of the property, however, Boolean and List properties result in equal step increases of the bubble colour within the chosen range in the exact order defined for the property regardless of their values. E.g. Low | Medium | High or 1, 2, 4, 8, 16.
9.Select either no bubble border colour or associate a property with the bubble border colour, then click Finish.
Note
Only Integer, Decimal, Boolean and List properties can be used for the bubble border colour. Furthermore, Integer and Decimal properties result in a bubble border colour within the chosen range scaled according to the value of the property, however, Boolean and List properties result in equal step increases of the bubble border colour within the chosen range in the exact order defined for the property regardless of their values. E.g. Low | Medium | High or 1, 2, 4, 8, 16.
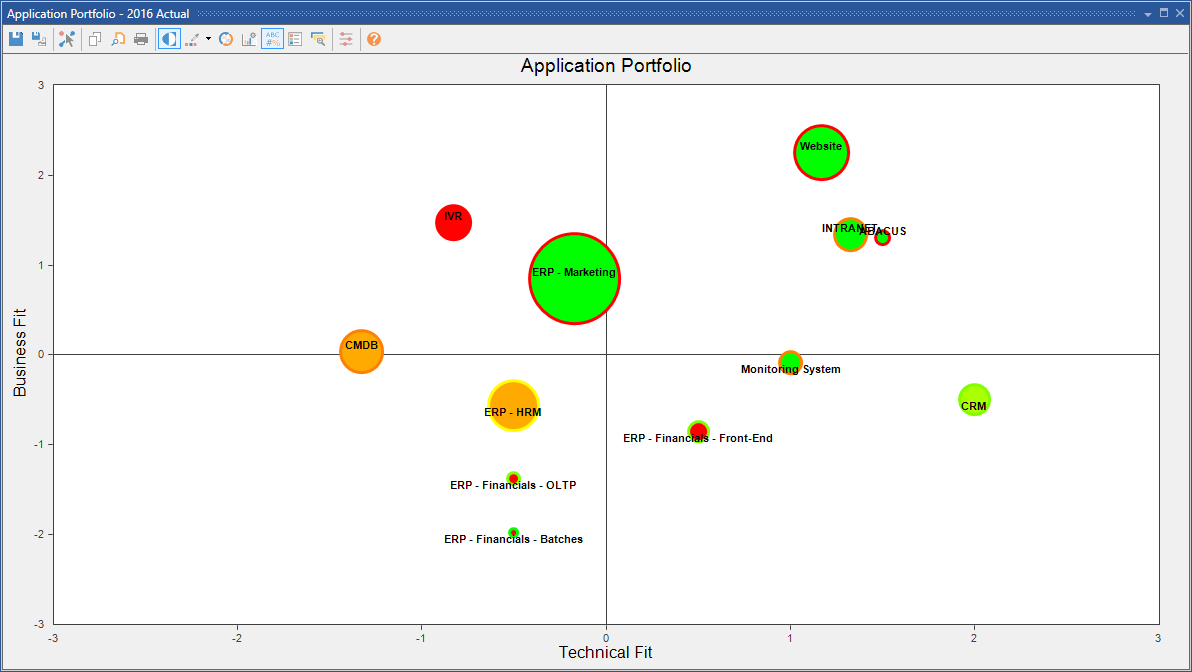
Bubble chart
To save a bubble chart
Note
Bubble charts can only be saved if they only contain components and connections, all of which must be from a single architecture within the current project.
1.Ensure that you have a new or existing bubble chart open and you have made the necessary changes.
2.In the chart toolbar click on the leftmost Save Chart button to save the chart and any formatting changes.
3.In the Chart Name dialog that appears enter a name for the bubble chart and press OK.
To export a bubble chart
1.Ensure you have open an existing bubble chart.
2.In the chart toolbar click on the 2nd from left Save As BMP button and chose the location for the chart.
3.Click Save.

See Also
Analysing your architecture
© 2001-2024 Avolution Pty Ltd, related entities and/or licensors. All rights reserved.
|