|
Once an architecture has been evolved and the goals are defined, it can then be visualised and compared with the original architecture using scatterplot matrices. This section outlines how to create and understand the characteristics of a scatterplot matrix.
To view a scatterplot Matrix of your evolved architectures
1.Ensure you have an ABACUS file open.
2.Ensure you have evolved and set goals for your architecture as outlined under Evolving your architecture
3.Select Insert | Chart | the Custom Charts tab | Scatterplot Matrix.
4.Click on the Finish button.
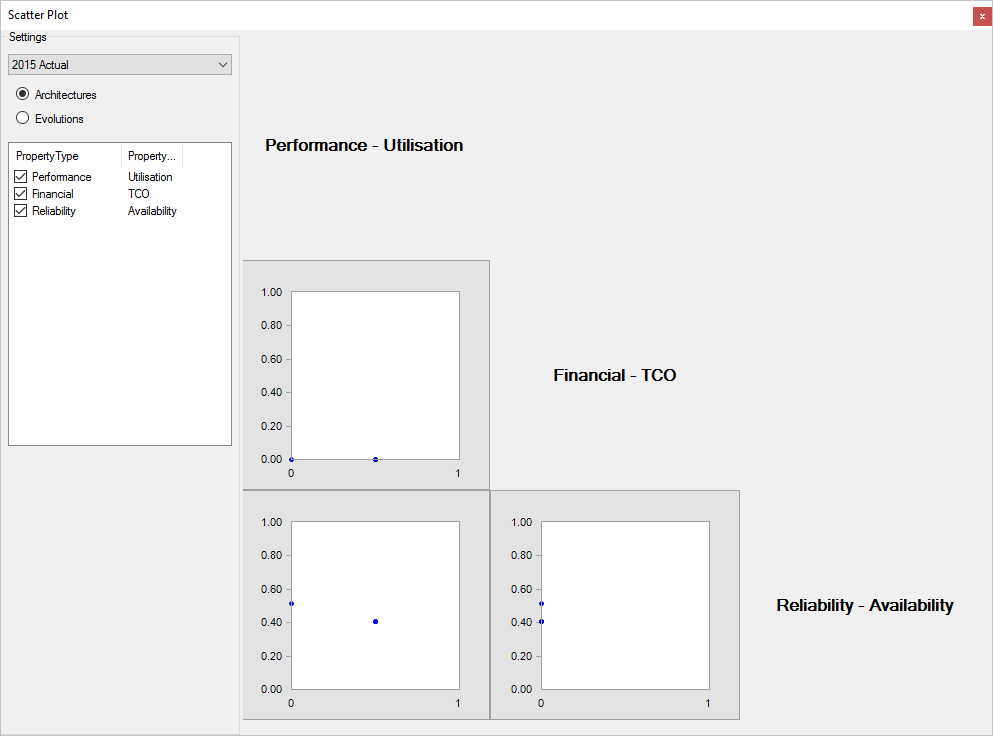
5.The Scatter Plot with the defined evolution of architectures and goals will be displayed.
 Note Note
The area on the left hand side of the scatterplot matrix shows the settings of the scatterplot matrix displayed. This includes the architecture that has been evolved (in this case "ABC Ltd As-Is 2010") as well as the goals that have been set for that architecture. You will note that the goals that have a tick mark next to them are represented as X and Y axes of the scatterplot matrix (e.g. KPI - Cost, KPI - Quality and KPI - Time). You may untick these goals at any point of time to remove them from the scatterplot matrix.
The blue dots that appear on your plot in the matrix represent a normalised value, as determined by the best and worst value (outlined under Setting goals for your evolved architecture). These values are represented in a Quality Space.
Two defined goals are compared against one another in a scatterplot matrix and the process is repeated until all the goals have been compared (e.g. The first plot of the matrix in the above diagram compares the KPI - Cost goal with the KPI - Quality goal. The second is Cost versus Time and the last plot is Quality versus Time. The relevant goal labels are shown at the top and right or each row of plots.).
6.Select the Architectures radio button if you want to display the metrics for the individual architectures.
7.Select the Evolutions radio button if you want to display the normalised changes from the original architecture (e.g. As-Is 2010) to the evolved architecture(s) (e.g. To-Be 2011 - Strategy A and To-Be 2011 - Strategy B).

See Also
Analysing your architecture | Viewing a response time chart | Viewing a star plot of your evolved architectures | Evolving your architecture
© 2001-2024 Avolution Pty Ltd, related entities and/or licensors. All rights reserved.
|