|
A response time chart allows you to view whether your connections are being processed at the required rate (i.e. within their deadline).
To view a response time chart
1.Ensure you have an ABACUS file open containing your populated architecture, and that you have evaluated your architecture.
2.Select Insert | Chart | Custom Charts | Response Time. (The Response Time Chart Config dialog will display.)
3.From the Architectures drop-down list, select the architecture you wish to chart.
4.In the Connections area, tick the connections you would like included in the chart.
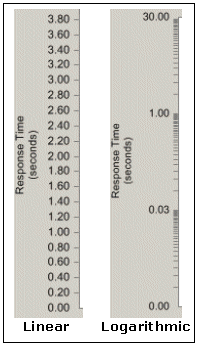
5.The Scale Type area, select Linear if you want the vertical axis (response time) to be displayed as a linear progression - each segment of time is allocated an equal share of the axis. Select Logarithmic if you want it displayed as a logarithmic progression - each segment of the axis represents increasingly longer periods of time the higher up the axis you go. (The rate of the increase is determined by the Base you select.)

Response time chart vertical axis scale
To export a response time chart
1.Ensure you have an existing response time chart open.
2.In the chart toolbar click on the leftmost Save As BMP button and chose the location for the chart.
3.Click Save.

See Also
Analysing your architecture | Viewing a capability space chart

© 2001-2024 Avolution Pty Ltd, related entities and/or licensors. All rights reserved.
|