|
Once an architecture has been evolved and the goals are defined, it can then be visualised and compared with the original architecture using star plots. This section outlines how to create and manipulate a star plot.
To view a star plot of your evolved architectures
1.Ensure you have an ABACUS file open.
2.Ensure you have evolved and set goals for your architecture as outlined under Evolving your architecture
3.Select Insert | Chart | the Custom Charts tab | Star Plot.
4.Click on the Finish button.
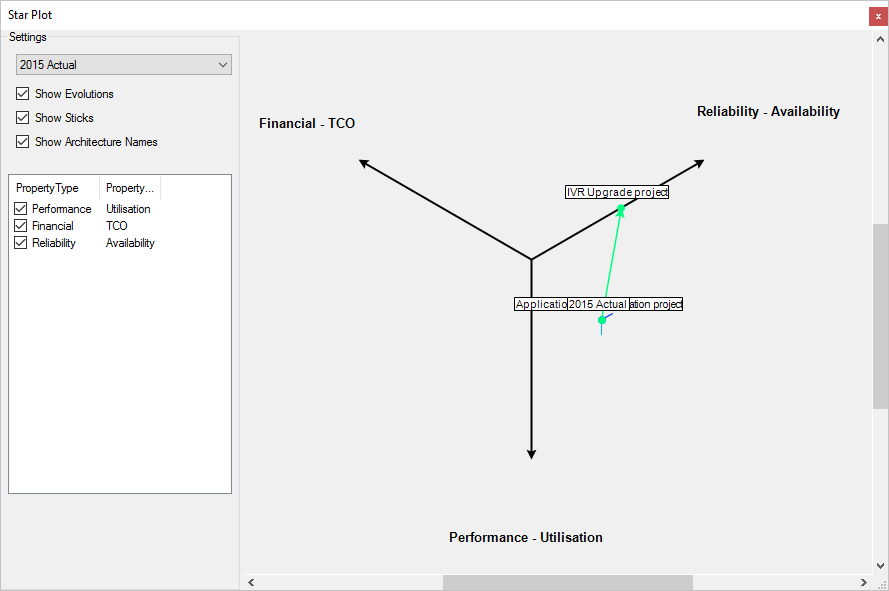
5.The Star Plot with the evolved architectures and set goals will be displayed. Note: The axes of the star plot may be repositioned by clicking and dragging the axes to another area within the bounds of the star plot quality space.
 Note Note
The area on the left hand side of the star plot shows the settings of the star plot displayed. This includes the architecture that has been evolved (in this case "ABC Ltd As-Is 2010") as well as the goals that have been set for that architecture. You will note that the goals that have a tick mark next to them are represented as axes of the star plot (e.g. KPI - Cost, KPI - Quality and KPI - Time). You may untick these goals at any point of time to remove them from the star plot.
The red and green "dots" that appear on your star plot represent a normalised value, as determined by the best and worst value (outlined under Setting goals for your evolved architecture) for the selected top-level architecture and any evolutions of it. These values are represented in a Quality Space.
As outlined in the image above, it is clearly visible that the original architecture (As-Is 2010) has poor Cost, while the first evolved option (To-Be 2011 - Strategy A) has moved within the quality space to improve the Cost, Quality and Time goals. Alternatively, the second evolved option (To-Be 2011 - Strategy B) while it has also improved the Cost the magnitude of the improvement is less than that of Strategy A but both the Quality and Time goals have been improved more than with Strategy A. In this case an architect may choose Strategy A over Strategy B as their recommendation and further evolve that option (To-Be 2012 - Strategy A).
6.Deselect the Show Evolutions check box to hide the line(s) representing the evolution(s) between the original (e.g. As-Is 2010) and evolved (e.g. To-Be 2011 - Strategy A) architecture(s).
7.Select the Show Sticks check box to display the relative magnitude of each quality attribute (the goals that have been defined on each axes) for each architecture.
8.Select the Show Architecture Names check box if you want to the names of the original and evolved architecture(s) to appear on the star plot.

See Also
Analysing your architecture | Viewing a response time chart | Viewing a scatterplot matrix of your evolved architectures | Evolving your architecture
© 2001-2024 Avolution Pty Ltd, related entities and/or licensors. All rights reserved.
|